Building a Downballot Testing Plan
Ad testing heavily shaped and likely significantly improved Democratic ads run in 2024.
However, with only special elections at the federal level this year, and the battle for the House of Representatives coming fast in 2026, our minds at Grow Progress are increasingly turning to helping clients get the most from testing for downballot races.
In this post, we’ll cover using our Persuasion Library to ground expectations about ad impacts, and learn from the broader movement as you plan downballot testing. Keep your eyes peeled for a post later this summer on new tools we’re rolling out to reduce costs and accelerate fielding in downballot testing.
How is testing for downballot races different from presidential ones?
Two main challenges leap out at us about downballot testing: greater range in effects, and fewer resources to discover what works.
It’s well known in our movement that downballot races see larger persuasion effects on average. This pattern consistently appears in both survey experiments like ours, and in field experiments as well. This makes intuitive sense—the higher salience the race, the harder it is to find ways to change peoples’ minds. Downballot races typically feature more undecided voters and softer initial preferences, since voters have less pre-existing information and emotional investment in lower-profile contests.
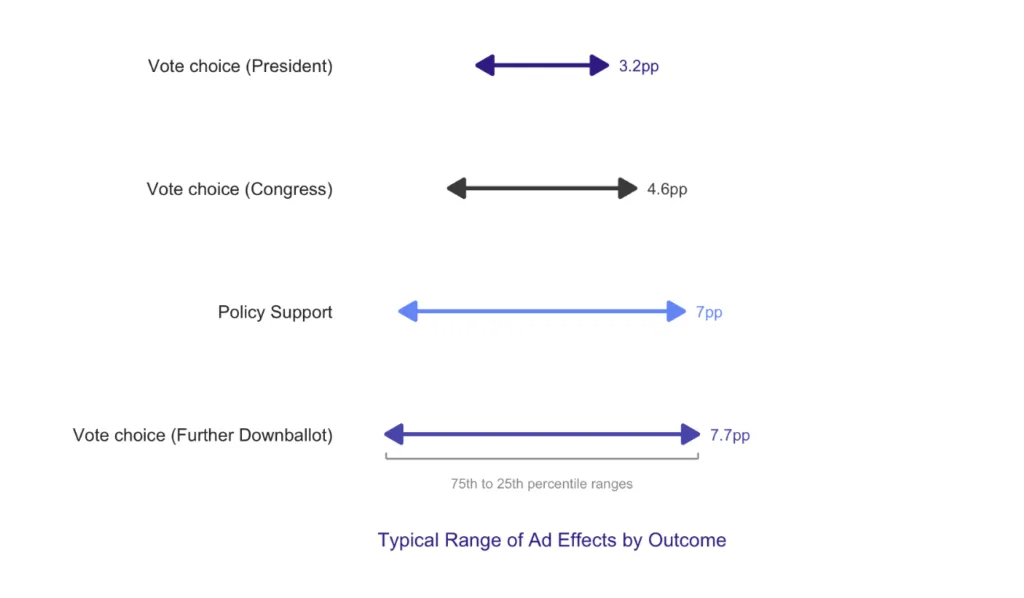
Crucially, we observe that beyond magnitude of effects, downballot races also see a greater range of effects (again, across survey experiments and field experiments). To illustrate this, we looked at the spread of ad performance in our 2024 tests. We measured the gap between fairly strong ads (those performing better than 75% of tested ads) and less successful ones (those performing better than only 25% of tested ads)¹. This gap was about 40% wider for House races compared to Presidential ones. Relative to a presidential race, a typical downballot race has a lot more to gain from differentiating their weaker creatives from their very best ones via testing.
Far from the billion dollar budgets of the largest campaigns and PACs however, downballot races typically also have fewer resources to do extensive testing themselves. These budgets also buy proportionally less testing downballot, since fielding costs are higher when targeting smaller, more specific audiences. Even if a campaign takes Hewitt et al.’s suggestion that it’s optimal to spend 10-13% of advertising budget on testing, that may still mean there’s only room for a handful of small tests.
How can Persuasion Library and Persuasion Trends help?
These two factors—higher variety and stakes for testing, along with less capacity to test—can make testing for downballot races feel daunting and consequential. Fortunately, you don’t have to go it alone!
Our view is that collaborative tools like Persuasion Library can significantly accelerate your ability to learn what works by drawing on the movement’s collective testing experience.
Quick Walkthrough: Persuasion Library & Persuasion Trends
Persuasion Library allows you to access and analyze results from thousands of messages tested across the progressive movement, while Persuasion Trends enables you to discover patterns in what’s working across different topics, demographics, and success questions via real time meta-analysis. While every race has its own context and themes, frames that work well often work across races in our increasingly nationalized political era. Leveraging this existing knowledge allows you to make smarter bets about the ads you’ll test specifically for your race.
Let’s walk through an example: what might a Congressional race in 2024 learn from Persuasion Library? If you’re a current client, we’d encourage you to jump into the tool here, and follow along. If you’re curious about working with us and want to get a taste, you can request access here.
First, from the summary view, across ~550 messages, we can see the average Congressional Vote Choice effect size across our experiments last cycle was around 1.5pp. If one were to change the success question filter to presidential, you’d see just a 1.1pp average effect. Even this initial view gives users a sense of scale for Congressional effects, and so a sense of what reasonable performance goals in a test might look like.

Moving beyond toplines is where meta-analyses like Persuasion Trends really start to shine. For example, if we switch to the Analysis tab, we can begin to look at average effect sizes by topic(s) the ads discussed. Two trends emerge: first, several organizations were particularly successful with ads on infrastructure (+2.5pp average effect) and second, users experienced backlash with climate change focused content (-1.6pp).

Of course, it’s natural to want to see the ads themselves—what were the most persuasive frames about infrastructure? What provoked backlash in the small handful of climate change ads? It’s easy to do this type of research by using the Filter menu in the upper right-hand corner, and filtering by topic, making it easy to find the relevant creatives. It turns out, for example, that the infrastructure ads that really popped tended to tie Biden’s infrastructure bill to middle class job creation.
Thinking Like a Strategist
Surveying the ad landscape this way can be incredibly powerful. Knowing what worked well for others, and how well it worked, can help you build out a short list of themes, creative formats, and issues to test in your own context. Similarly, knowing what hasn’t worked so far can help you understand what might need tweaking to make a less successful frame succeed in your race.
Like with any quantitative tool, we want to caution against overconfident use of meta-analysis, especially as the number of ads in your query gets smaller. Do the results in this example mean that, for example, you should never run or test a creative about climate change? Of course not; as a movement, we need to work together to explore and find the frames that work best! However, it’s helpful to know that Congressional-focused messages about climate change haven’t succeeded—yet. If you want to succeed where others have had less success, take a look at their ads and have a clear theory of why your race is possibly different than theirs, or your creative content is plausibly better.
Conclusion
To recap: ad testing downballot can feel challenging. Differences between ads are wider, and budgets to understand those differences are tighter. Discovering what works can be made significantly easier through collaborative tools like Persuasion Library, allowing you to see what’s working for the movement in similar races, and why.
While we walked through a Congressional race example to illustrate this, with over 7,000 pieces of content shared in Persuasion Library and counting, most organizations will likely find something to learn from the broader community. If you don’t yet have access, click here to request access. Happy testing!